PODIMECS
POwer factor and |
Contracted, for three years, between The Ministry of Science and environmental protection of Serbia, as the financier (Project No. EE-232014), The Faculty of electronic Engineering, as the researcher organization, and "Pakom computers" Niš, as industrial partner. The financing of the project started on May, 2005. The main research targets of this project, belonging to the Electrical efficacy program of the Serbian Government, are related to creation of simple and non expensive methods and apparatus for power factor measurement and distortion characterization of small (electronic) loads. |
Introduction
Power factor and distortion measuring usually requires special and expensive equipment. Computer-based acquisition modules and software provide possibility to create simple and non-expensive methods and instruments for power factor measurement and distortion characterization of small loads and bring all advantages of virtual instrumentation.
In linear circuits, consisting of linear loads the currents and voltages are sinusoidal and the power factor effect arises only from the difference in phase between the current and voltage. The notion of power factor can be generalized to a total, distortion, or true power factor where the apparent power includes all harmonic components. This is of importance in practical power systems which contain non-linear loads such as rectifiers, especially switched-mode power supplies.
The industry standards regulate the limits (minimum) of power factor. One of the most paradigmatic examples is personal computer that typically includes switched-mode power supply (SMPS) with output power ranging from 150W to 500W. SMPS with passive power correction factor (PFC) can achieve power factor of about 0.7 – 0.75, SMPS with active PFC – up to 0.99, while SMPS without any PFC has power factor of about 0.55 – 0.65 in the best. The current EU standard EN61000-3-2 appoints that all SMPS-es with output power more than 75W must include at least passive power factor correction.
The measurement of power factor and distortion usually requires special equipment. For example, a classical ampermeter will return incorrect results when attempting to measure the AC current drawn by a non-linear load and then calculate the power factor. A true RMS multimeter must be used to measure the actual RMS currents and voltages and apparent power. To measure the real power or reactive power, a wattmeter designed to properly work with non-sinusoidal currents must be also used.
Computer-based acquisition modules and software provide possibility of creation of simple and
non-expensive methods and instruments for power factor measurement and
distortion characterization up to 40 harmonics of small loads and bring all
advantages of virtual instrumentation.
Hardware implementation
Data acquisition is performed using an acquisition module. The system for power factor and distortion measurement is based on National Instruments NI USB-9215A acquisition module (DAQ) [8]. The data acquisition module has four channels of simultaneously sampled voltage inputs with 16-bit accuracy, 100kS per channel sampling rate and 250VRMS channel-to-earth isolation, adequate for voltage measurements up to 40th harmonic (2kHz). It also provides portability and hot-plug connectivity via USB interface.
For power factor and distortion measuring, two channels are used: for voltage and current measurement. The analogue inputs of acquisition module are connected using differential measurement method [9], due to better noise rejection and channel-to-earth isolation.
Figure 1 Differential method
The noise influences to measurement precision of small current and voltage values, such as values for higher harmonics. Both of the connection points of a differential system are tied to instrumentation amplifier. There are no terminals connected to a fixed reference. In order to increase CMRR, a resistor can be connected between inverted input of instrumentation amplifier and ground. The resistance must have value of hundred equivalent Thevenin’s resistance between connection points (inverted and non-inverted terminal of instrumentation amplifier). It is also possible to connect the second resistor between non-inverted terminal and ground. This configuration provides greater CMRR, but there is a systematic error in measurement caused by serial connection of resistors.
Figure 2 Schematic of the measuring system and the PCB layout
Since the input range of analogue inputs of acquisition module is limited to ±10V, it is necessary to reduce measured voltage from 220VRMS to supported measurement range. In this application, the measured voltage is reduced by resistor divider R1/R2 connected to voltage channel. Both voltage and current channels are protected of overload with diodes (D1, D2, D3, D4) and fuses (F1, F2, F3). Consequently, maximal channel voltage is limited to VZ+VD, which is approximately ±11V, and the current limited to 100mA. It is recommended to use transformer for galvanic isolation between the measuring system and power grid.
The measurement of currents can be performed only indirectly, by transforming current into voltage using resistor R3. In this implementation we used 5Ω, 1% tolerance metal-film resistor, due to better precision of measurement. Consequently, the value of 1A is equivalent to 5V. The value calculation is performed as software function. The current measurement using Hall effect sensor is also considered.
The measuring system is integrated on a printed circuit board (figure 3).
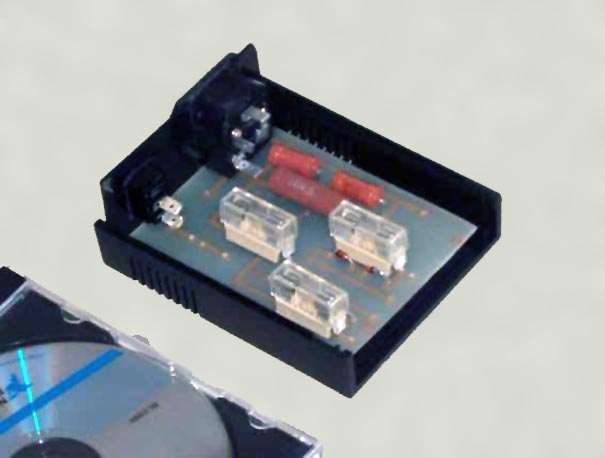
Figure 3 The
measuring system
Software implementation of power factor and distortion measuring system
Software part of the power factor and distortion measuring system is implemented in National Instruments LabVIEW developing package (figure 4), which provides simple creation of virtual instruments [10]. Virtual instruments consist of interface to acquisition module and application with graphic user interface.
Interface to acquisition module is implemented as device driver. USB-9215A module is supported by NIDAQmx drivers. All the measurements are performed using virtual channels. A virtual channel is collection of property settings that can include name, a physical channel, input terminal connections, the type of measurement or generation, and scaling information. A physical channel is a terminal or pin at which an analogue signal can be measured or generated. Virtual channels can be configured globally at the operating system level, or using application interface in the program. Every physical channel on a device has a unique name.
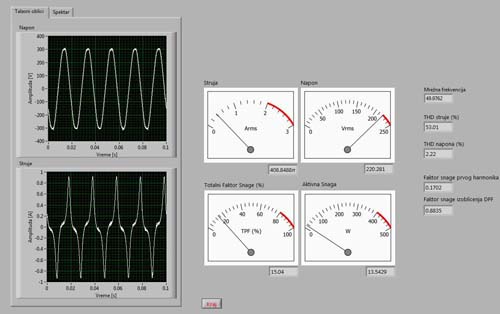
The user interface of the virtual instrument consists of visual indicators. It provides basic functions for measurement. The indicators – gauges and graphs – show measured values. All measured values are placed in a table, and after the measurement process in appropriate file. User interface also provides controls for data manipulation and saving measured values (figure 5).
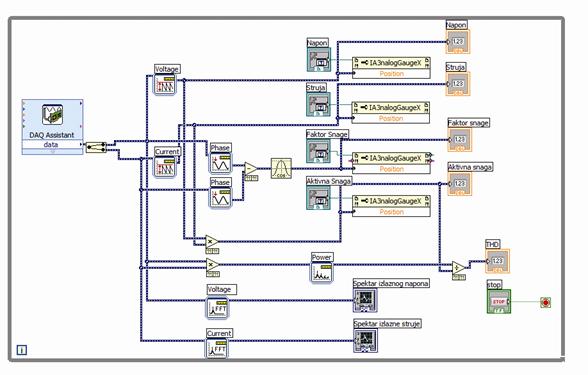
Figure 4 Main thread of application
For better performance, the main application has been separated into two threads. The first thread has functions for file manipulation and saving measured values (figure 3). All measured values will be saved in HTML file format.
Different examples of the virtual instrument
Computer SMPS with high current distorsion - spectrum
Computer SMPS with high current distorsion - waveform
Inductiivity device with current distorsion - spectrum
Inductiivity device with current distorsion - wa
veform
Computer monitor SMPS with low current distorsion - spectrum
Computer monitor SMPS with low current distorsion - waveform